
Ang Su Yiin
March 9, 2021
Likert Scale
Documenting my Tableau learning journey.
Likert Scale
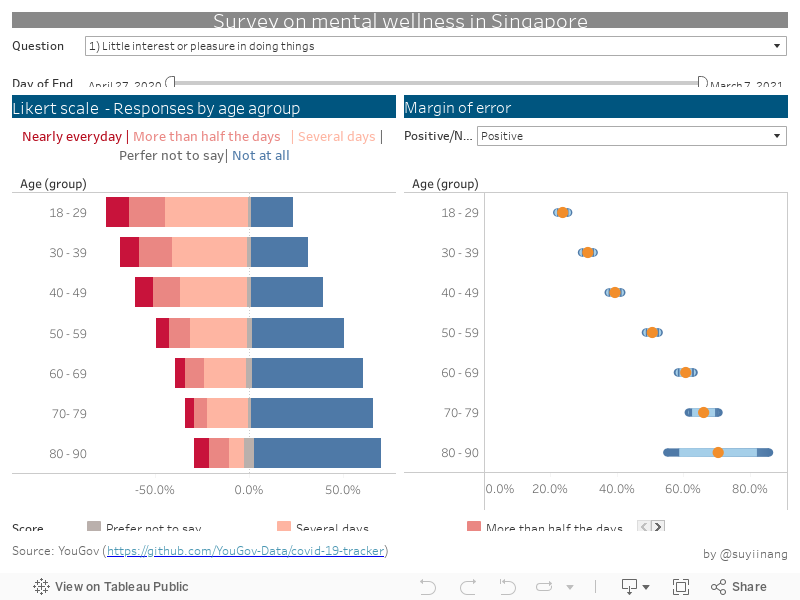
Survey on mental wellness in Singapore.
Full visualisation available on Tableau Public.
Good for
Analysing survey data
How to create - step by step
I have used the Covid-19 tracker data for Singapore from YouGov.
Data Cleaning - MS Excel
As there are quite a number of survey questions, I have only retained 4 questions relating to mental health (PHQ questions) and some demographic data.
Blank observations were removed from my final dataset.
Data Preparation - Tableau
Pivot data

Rename headers

Create score

Create alias for score

Create alias for Question

Create age group

Likert Scale with neutrals by the side
- Create calculated fields
- No of records

- Count positive/negative/neutral
Due to the nature of the responses, I have categorised the responses 3 types of sentiments:
Sentiments Responses Positive Not at all Neutral Prefer not to say Negative Several days, More than half the days, Nearly everyday

- Sentiment percentage

Arrange variables

Change chart type to “Bar”, Select dual axis and synchronize axis, remove measure names.

Add neutral %

Fix axis of neutrals to align both charts

Format chart according to preference.
Here you have a likert scale chart with neutrals by the side.

However, given that the percentage of neutrals are relatively small, it may be more meaningful to have neutrals between the positive and negative responses
The usual likert scale
- Create calculated fields
- Count positive/negative/neutral

- Sentiment percentage

Put it together

Repeat step 3 as mentioned above - Change chart type to “Bar”, Select dual axis and synchronize axis, remove measure names.
Sort % score accordingly.

There you have a likert scale chart!
Adding some interactivity
- Add [Question] and [Endtime] to Filters. Select show filter for both.
For Question - select Single Value (dropdown) for [Endtime] select Range of Dates.

And.. there you have it! Likert scale showcasing survey results.

I would like to thank Prof Kam of Singapore Management University for the inspiration.