
Ang Su Yiin
February 9, 2021
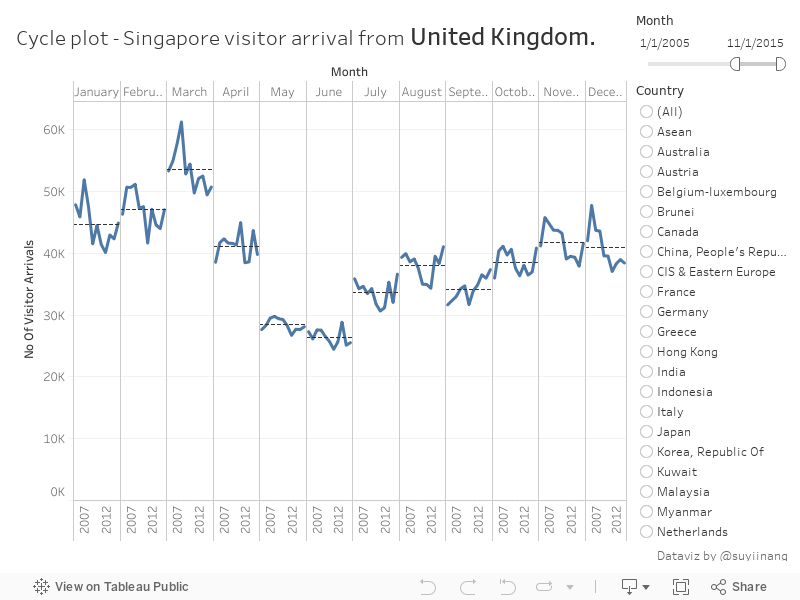
Cycle Plots
Documenting my Tableau learning journey.
Cycle plots
Here we can see that visitors from the UK are typically lower in the months of May and June, and higher in March.
Good for
Analysing seasonality / cyclical patterns
How to create - step by step
I have used the monthly international visitor arrivals by country data from data.gov.sg.
Step 1 - Date column in correct data type
Make sure data column is in the “Date” data type.

Step 2 - Data in flat file format
Here my download data is already in flat file format, ie stacked downwards, hence no further transformation is required.
However, if your data is across the columns (see figure 3 below), you will need to pivot the data into a flat file. (Don’t worry! Tableau makes this very easy).
Select the necessary columns, right click and select ‘Pivot’ and there you have it!
Step 3 - Filter Date
My current dataset has data from year 1978 to 2015, which may be too overwhelming.
For this exercise, I only want data from 2005 to 2015. (SARS affected Singapore’s tourism in 2004, hence I want to exclude that as it is a anomaly.)
To do so, drag the “Month” field to the Filters panel > Range of Dates and apply filter according to the figure below.
Right click and show filter. You can move the slider according to the dates desired.
Step 4 - Populate columns and rows
Populate rows according to the figure below.
Step 5 - Filter country
To see the cycle plot by country, add country into the Filters panel, select one country > right click > show filter. The list of countries should be to the right of the chart.
Click on the arrow button of the Country filter and select “Single Value (list)”.
Step 6 - Add reference line
Right click on y-axis > add reference line > fill according to the figure below.
This shows me the average visitors per month across the years.
Step 7 - Create dynamic title
I want a dynamic title that changes according to my country filter.
Use the “Insert” dropdown to insert field name.
And… there have you it! An interactive cycle plot ready for analysis!
I would like to thank Prof Kam of Singapore Management University for the inspiration.